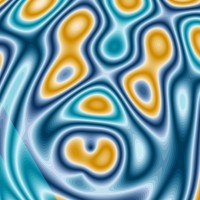
Noise Equalization

by
How to apply histogram equalization to noise fields for more even distribution of values between 0 and 1.
- mySketch
62
function setup() { createCanvas(1000, 1000); squareSize = 10; noiseSeed(6); noise_scale = 0.0005; background(100);}function draw() { noLoop(); // We'll keep track of noise() values in a histogram hist_plot_bins = 50; histo_to_plot = Array(hist_plot_bins).fill(0); // Loop through each row and column of a grid for (let row = 0; row < height / squareSize; row++) { for (let col = 0; col < width / squareSize; col++) { // Calculate the x and y position of the square let x = col * squareSize; let y = row * squareSize; n = noise(x * noise_scale, y * noise_scale); fill(n * 255); noStroke(); // Draw the square rect(x, y, squareSize, squareSize); // Fill our histogram with noise() values hist_plot_bin = int(n * hist_plot_bins); histo_to_plot[hist_plot_bin] += 1; } } // Draw the histogram { sum_histo_plot_counts = histo_to_plot.reduce((a, b) => a + b, 0); max_histo_count = Math.max(histo_to_plot); histo_w = 400; histo_h = 100; noFill(); stroke(255); strokeWeight(1); translate(width/8, 3*height/4) rect(0, 0, histo_w, histo_h); for (x = 0; x <= hist_plot_bins; x += 1) { fill(255, 0, 0); normalized_height = map(histo_to_plot[x], 0, max_histo_count, 0, 1, true) * 100; rect( x / hist_plot_bins * histo_w, histo_h, histo_w / hist_plot_bins, -normalized_height ); } } }- v1.11.3
- v1.11.2
- v1.11.1
- v1.11.0
- v1.10.0
- v1.9.4
- v1.9.3
- v1.9.2
- v1.9.1
- v1.9.0
- v1.8.0
- v1.7.0
- v1.6.0
- v1.5.0
- v1.4.2
- v1.4.1
- v1.4.0
- v1.3.1
- v1.3.0
- v1.2.0
- v1.1.9
- v1.1.7
- v1.1.5
- v1.1.4
- v1.1.3
- v1.0.0
- v0.10.2
- v0.9.0
- v0.8.0
- v0.7.3
- v0.7.2
- v0.6.1
- v0.6.0
- v0.5.16
- v0.5.11
- v0.5.8
- v0.5.7
- v0.5.2
Select mode or a template
Centers sketch and matches the background color.
Prevents infinite loops that may freeze the sketch.
This will be the default layout for your sketches
Easy on the eyes
It will show up when there is an error or print() in code
Potential warnings will be displayed as you type
Closes parenthesis-like characters automatically as you type
Controls
Play
Ctrl+Enter
Code
Ctrl+Shift+Enter
Save
Ctrl+S
Interface
Fullscreen
Ctrl+Alt+F
Switch Layout
Ctrl+Alt+L
Settings
Ctrl+Alt+.
Editor
Tidy Code
Ctrl+B
Multiple Cursors
Ctrl+Click
Duplicate Line/Selection
Ctrl+Shift+D
Move Line
Alt+↑/↓
Select Multiple
Ctrl+D
Find in Code
Ctrl+F
Find Next
Ctrl+G
Find Previous
Ctrl+Shift+G